Page 2 |
Which span of time recorded the most reports of incidents?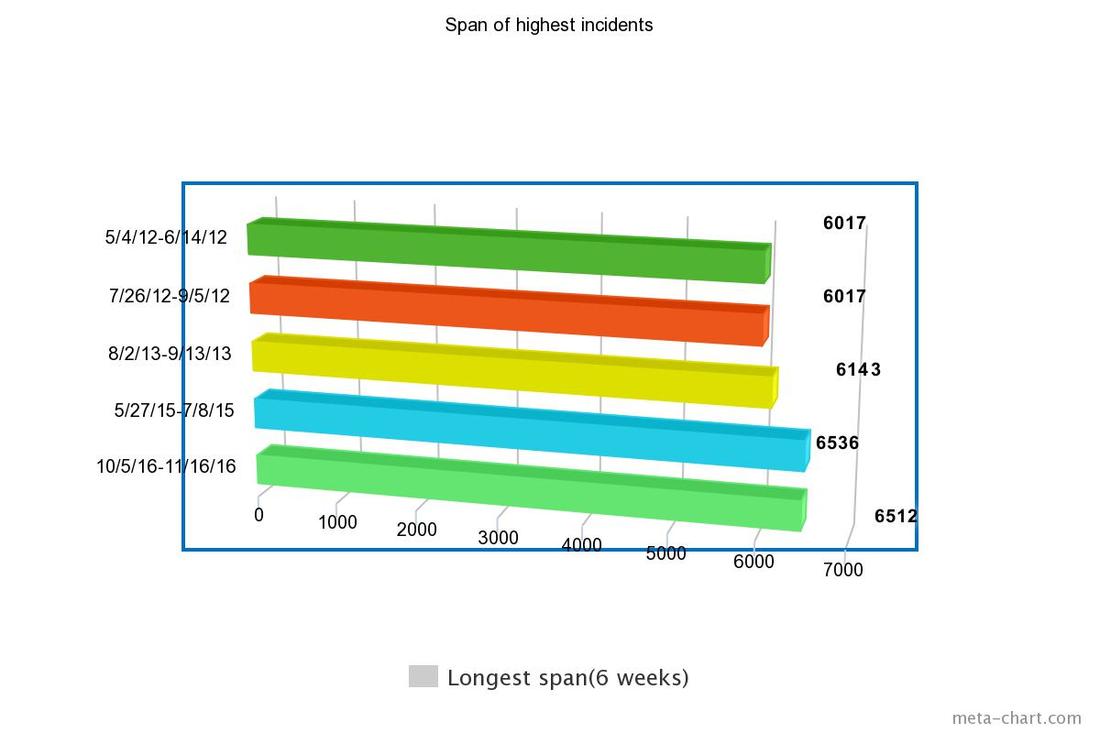
|
What type of crime is the most commonly committed?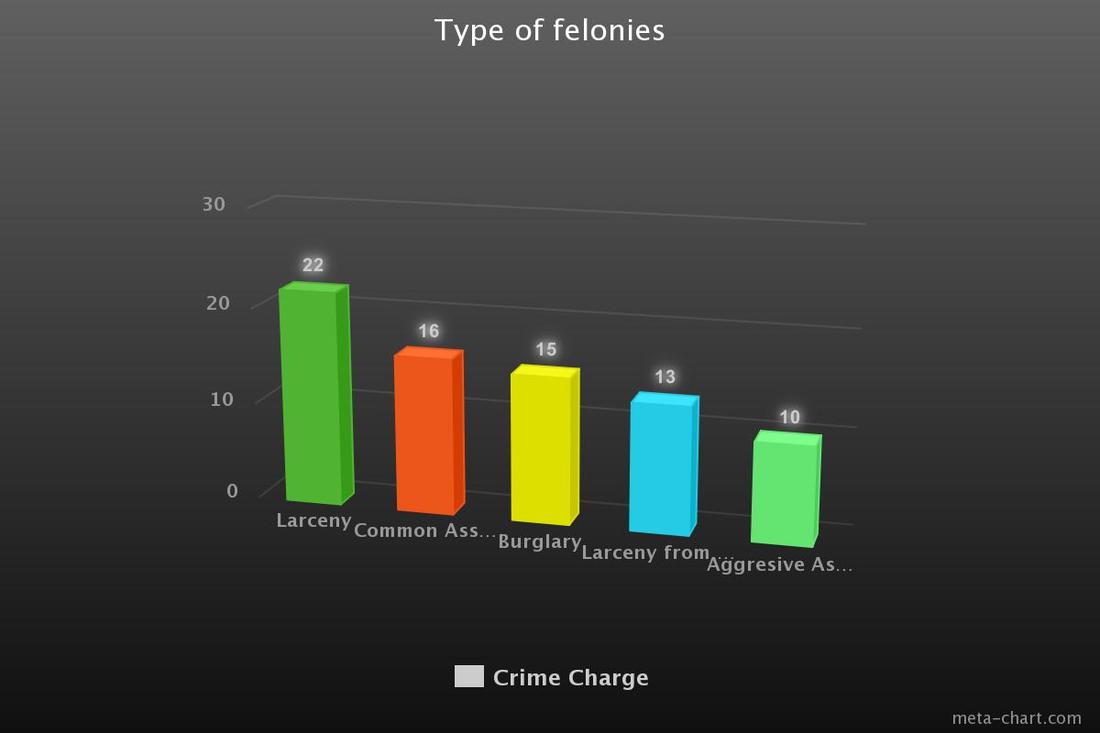
The chart above represents percentages.
|
Which Neighborhoods were most called to?(Percentages)
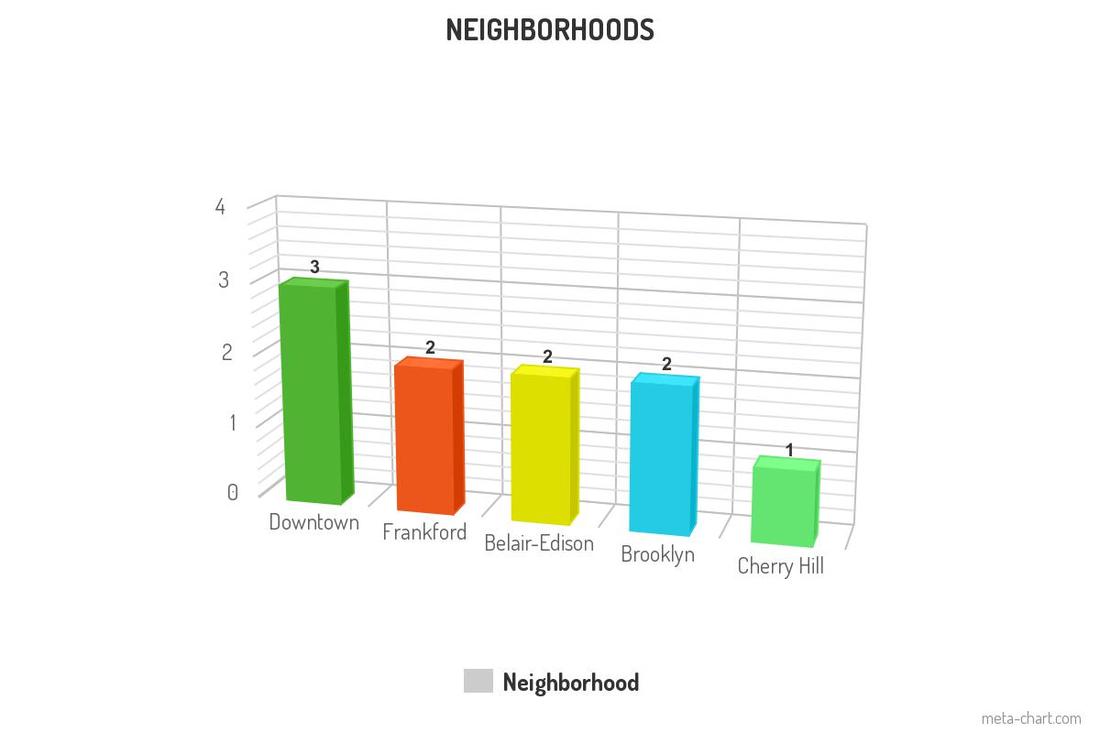
|
ConclusionI have learned multiple things from this dataset involving crime in Baltimore for the past five year(excluding 2018). Specially from data analysis, the process is very tendentious, it takes a extreme amount of time. Of course excel makes the job easy with the format and organization of data. This really clears up how much really occurs and puts it to numbers so decisions could be made, in this case, Larceny occurs almost 8% more than other. So the word should be put out that security should be heighten in some locations.
My data set analysis could be used for local government. Like the districts that have more incidents than other should have more patrol cars monitoring that location. Firearms are used in a percentage of crimes, so the cops need to be prepared in these cases. Again with security because of the percentage of theft. Baltimore can use the last five years to improve their defense for the next five years.
A business could use this information to plan according. They don't want to open a business in a very high crime rated location, but instead where calls are limited. Another instance could be in which season that crimes occur, even though its very scatted , it looks like during the summertime, crime rises for that period.
A lot of information can be used in this set. Things like were these incidents deadly?Were lives taken? How many? Has police brutality been reported? These factors can make Baltimore even more prepared and business even more informed of the locations that need help. It could also show that some patrol cars aren't doing their job if crime keeps rises with low results and deadly circumstance occur. This dataset is very limited to crime and type in which they occurred. It could be improved in multiple ways.
|
